Ultraviolet-Visible Spectroscopy (UV-Vis) and Colourimetry
This is part of the HSC Chemistry course under Module 8 Section 1: Analysis of Inorganic Compounds.
HSC Chemistry Syllabus
- Conduct investigations and/or process data to determine the concentration of coloured species and/or metal ions in aqueous solution, including but not limited to, the use of:
What is UV-visible Spectrophotometry and Colourimetry?
This video introduces what UV-visible spectrophotometry and colourimetry is.
What is Ultraviolet-Visible (UV-Vis) Spectrophotometry?
- In a typical UV-visible spectrophotometer, the sample is exposed to radiation in the UV range (10–400 nm) and/or visible light range (400-700 nm).
- UV radiation is more energetic than visible light, which in turn is more energetic than infrared radiation.
- UV radiation has shorter wavelengths than visible light which in turn has shorter wavelength than infrared radiation because energy is inversely proportional to wavelength.

- When the energy matches that required to excite an electron from one level to another, absorption occurs. Otherwise, the radiation passes through and no absorption occurs.
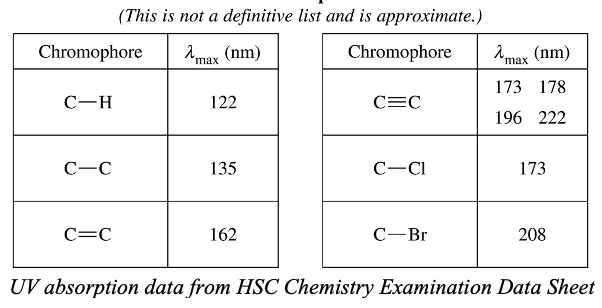
- Electrons in different bonds in organic compounds require different amounts of energy to be excited. Thus, the absorption wavelength of these bonds (chromophores) are different as shown.
|
Cuvette with yellow coloured analyte |


- A typical spectrum is shown below. The wavelength of the radiation is plotted on the x-axis. The amount of radiation absorbed at each wavelength is plotted on the y-axis.
- At wavelength where no absorption occurs, the absorption is zero.
- lmax refers to the absorption 'peak' in the curve.

- The peak absorbance is proportional to its concentration, given by Beer-Lambert’s Law:
$$A = \varepsilon cl$$
Where A is the maximum wavelength, epsilon is the extinction coefficient (absorption constant of the analyte), c is the concentration of the analyte and l is the optical path length of the UV/visible light ray.
What is Colourimetry?
|
|

- In a spectrophotometer (colourimeter), a light source is passed through a monochromator which splits it into different wavelengths (colours).
- A slit selectively allows light rays of a particular wavelength to pass through a cuvette which contains the sample solution. The % of light that passes through the cuvette is analysed and referred to as the % of transmittance or %T.
- Before the absorbance of standard solutions and the unknown sample can be analysed, the colourimeter must be ‘blanked’ using the solvent e.g. water. This is done so that the absorbance of the solvent does not contribute to the absorbance reading.
Absorbance = 2 – log(%T).
- Standard (calibration) curve – absorbance at a particular wavelength is measured and plotted against various dilutions of a sample of known concentration.
- The line of best fit of the standard curve obeys Beer’s Law which describes the direct proportionality between absorbance and concentration of a particular analyte.
|
$$A =\varepsilon Cl = log_{10}(\frac{I_0}{I})$$
|
 |
Fe3+(aq) + SCN–(aq) ⇌ FeSCN2+(aq)
|
 |

Example of Colourimetry
A colorimeter was used to calculate the percentage of iron in a 0.200 gram tablet.
The tablet was dissolved and oxidised, then reacted with thiosulfate according to the equation
$$Fe^{3+}(aq) + SCN^{-1}(aq) \rightarrow [FeSCN]^{2+}(aq)$$
The resulting solution was made up to 200 mL with distilled water. The absorbance of the final solution was measured to be 0.6105.
The calibration curve shows the absorbance of various concentrations of Fe3+.

Calculate the percentage of iron in the tablet.
From graph, absorbance of 0.615 initial Fe3+ = 5.5 x 10⁻⁵ mol L–1 in 200 mL solution.
To calculate moles of Fe3+: n = cV
$$= 5.5 \times 10^{-5}mol\hspace{0.1cm}L^{-1} \times 0.2L$$
$$= 1.1 \times 10^{-5} \hspace{0.1cm}mol$$
Mass of iron
$$= 55.85 \hspace{0.1cm} g \hspace{0.1cm} mol^{-1} \times 1.1 \times 10^{-5} \hspace{0.1cm} mol$$
$$ = 6.14 \times 10^{-4} \hspace{0.1cm} g$$
Percentage of irons
$$= (\frac{6.14 \times 10^{-4}}{0.200}) \times 100 $$
$$=0.307%$$